This is an old revision of the document!
Table of Contents
Statistics
Keep all important graphs on one view due to detailed approach graphs and landing report with export and replay functions including Google Earth export.
General Statistics
In this section you get an overview about all important aircraft parameters.
You can click on each of the graphs to show it maximized. Click on it again to revert it to normal size.
Airspeed
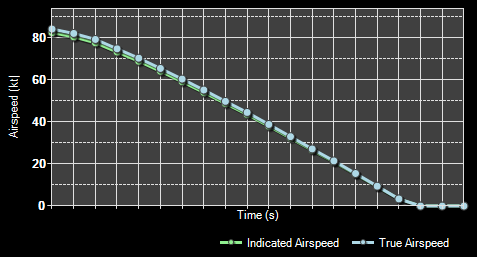
The first graph shows the current indicated and true airspeed.
Altitude
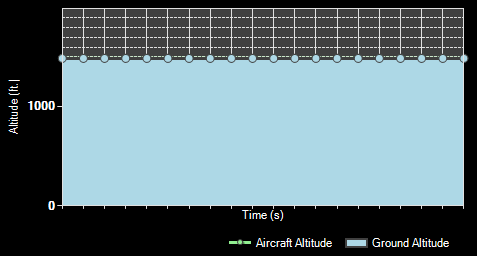
Here the aircraft altitude above mean sea level (MSL) as well as above ground is displayed.
Vertical Speed
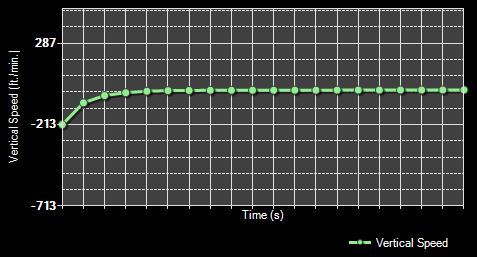
This graph shows the current vertical speed per minute.
Attitude
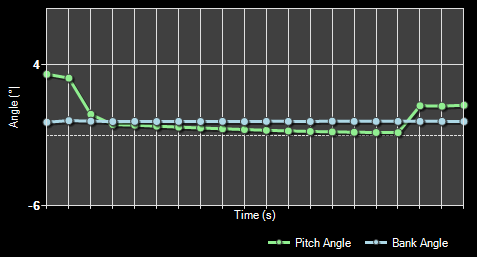
And finally here the aircraft attitude is shown as bank and pitch angle.
Recording and Playback

At the bottom left you will find the recording and playback controls.
You can start and stop the live recording of aircraft data at any time. While the recording is stop you can use the playback controls to go through the recorded data easily. If you want to delete all recorded data and start all over again use the button Clear All Flight Data.
Import and Export
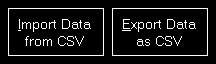
Additionally you can import and export the flight data from respectively to a CSV file.
Print Charts

You can also print the displayed charts by clicking on the Print Charts button.
Export to Google Earth

Also an export to Google Earth is possible.
You can even choose if VORs, NDBs or waypoints should be exported as place marks additionally.
 Note: The range around the flight path where VORs, NDBs and waypoints are included can be adjusted in the Settings module.
After pressing the button Export to Google Earth you can directly start Google Earth with the exported data as long as Google Earth is installed on the current computer.
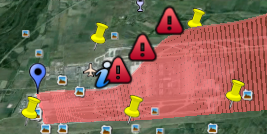
Here you can see how your flight data will look like then when it is shown in Google Earth.
Approach Statistics
After you started an approach in the Position module in this section your approach will be tracked.
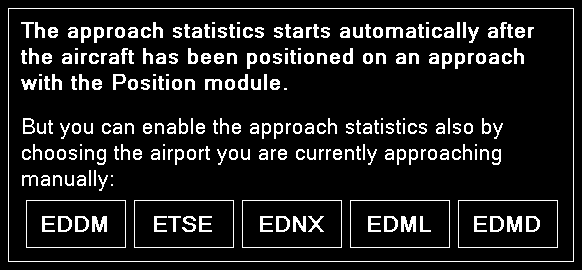
Additionally you have the option to select a near airport directly by just clicking on the ICAO code of the airport that you want to approach.
Note: Selecting an airport here does not change your aircraft position. This just provides you with the option to activate the approach statistics if you approach an airport manually without positioning your aircraft on an approach position first.
Approach Details
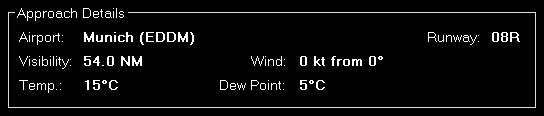
This section shows some details about the current approach like the airport, runway and some visibility information.
Landing Report
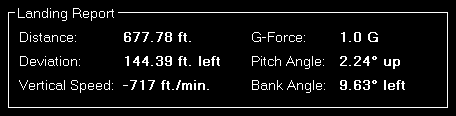
After the approach has been completed and the aircraft is landed, this landing report shows detailed information about how well the landing was.
Localizer Deviation
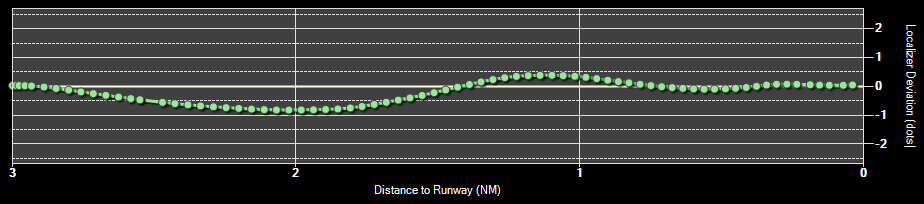
The localizer deviation graph shows the horizontal deviation from the runway localizer on your approach.
If the graph line goes to the top of the graph the aircraft is left from the localizer and if the line goes to the bottom the aircraft is right from the localizer.
Glideslope Deviation

On the lower approach graph the current aircraft altitude above mean sea level (MSL) as well as the ground altitude is shown.
The yellow straight line shows the ideal glideslope.
If the runway is ILS enabled the correct runway-specific glideslope degree will be used. Otherwise the default of 3° will be used.
Print Approach Statistics

The whole approach statistics can be printed with the button Print Approach Statistics.
Reset

Use the button Reset to reset the approach statistics again.